One request for the whole fleet
A single /api/dashboard call returns every group,
pipeline, pause state and latest run. There is no per-pipeline
polling anywhere in the extension.
 GoCD Lens
Chrome · Edge · Brave
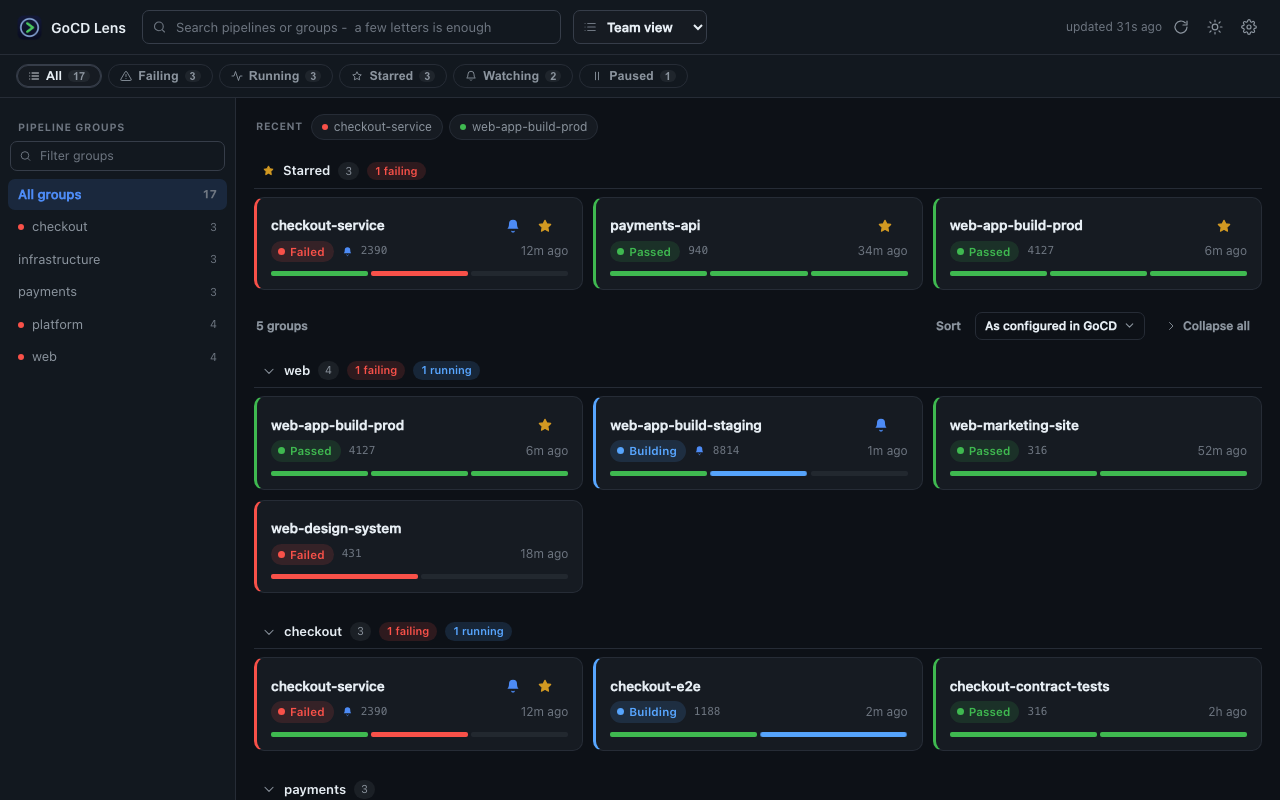
Built for instances with thousands of pipelines: one request loads the whole fleet, every card shows where a run got to stage by stage, and four letters are enough to find the one you want.
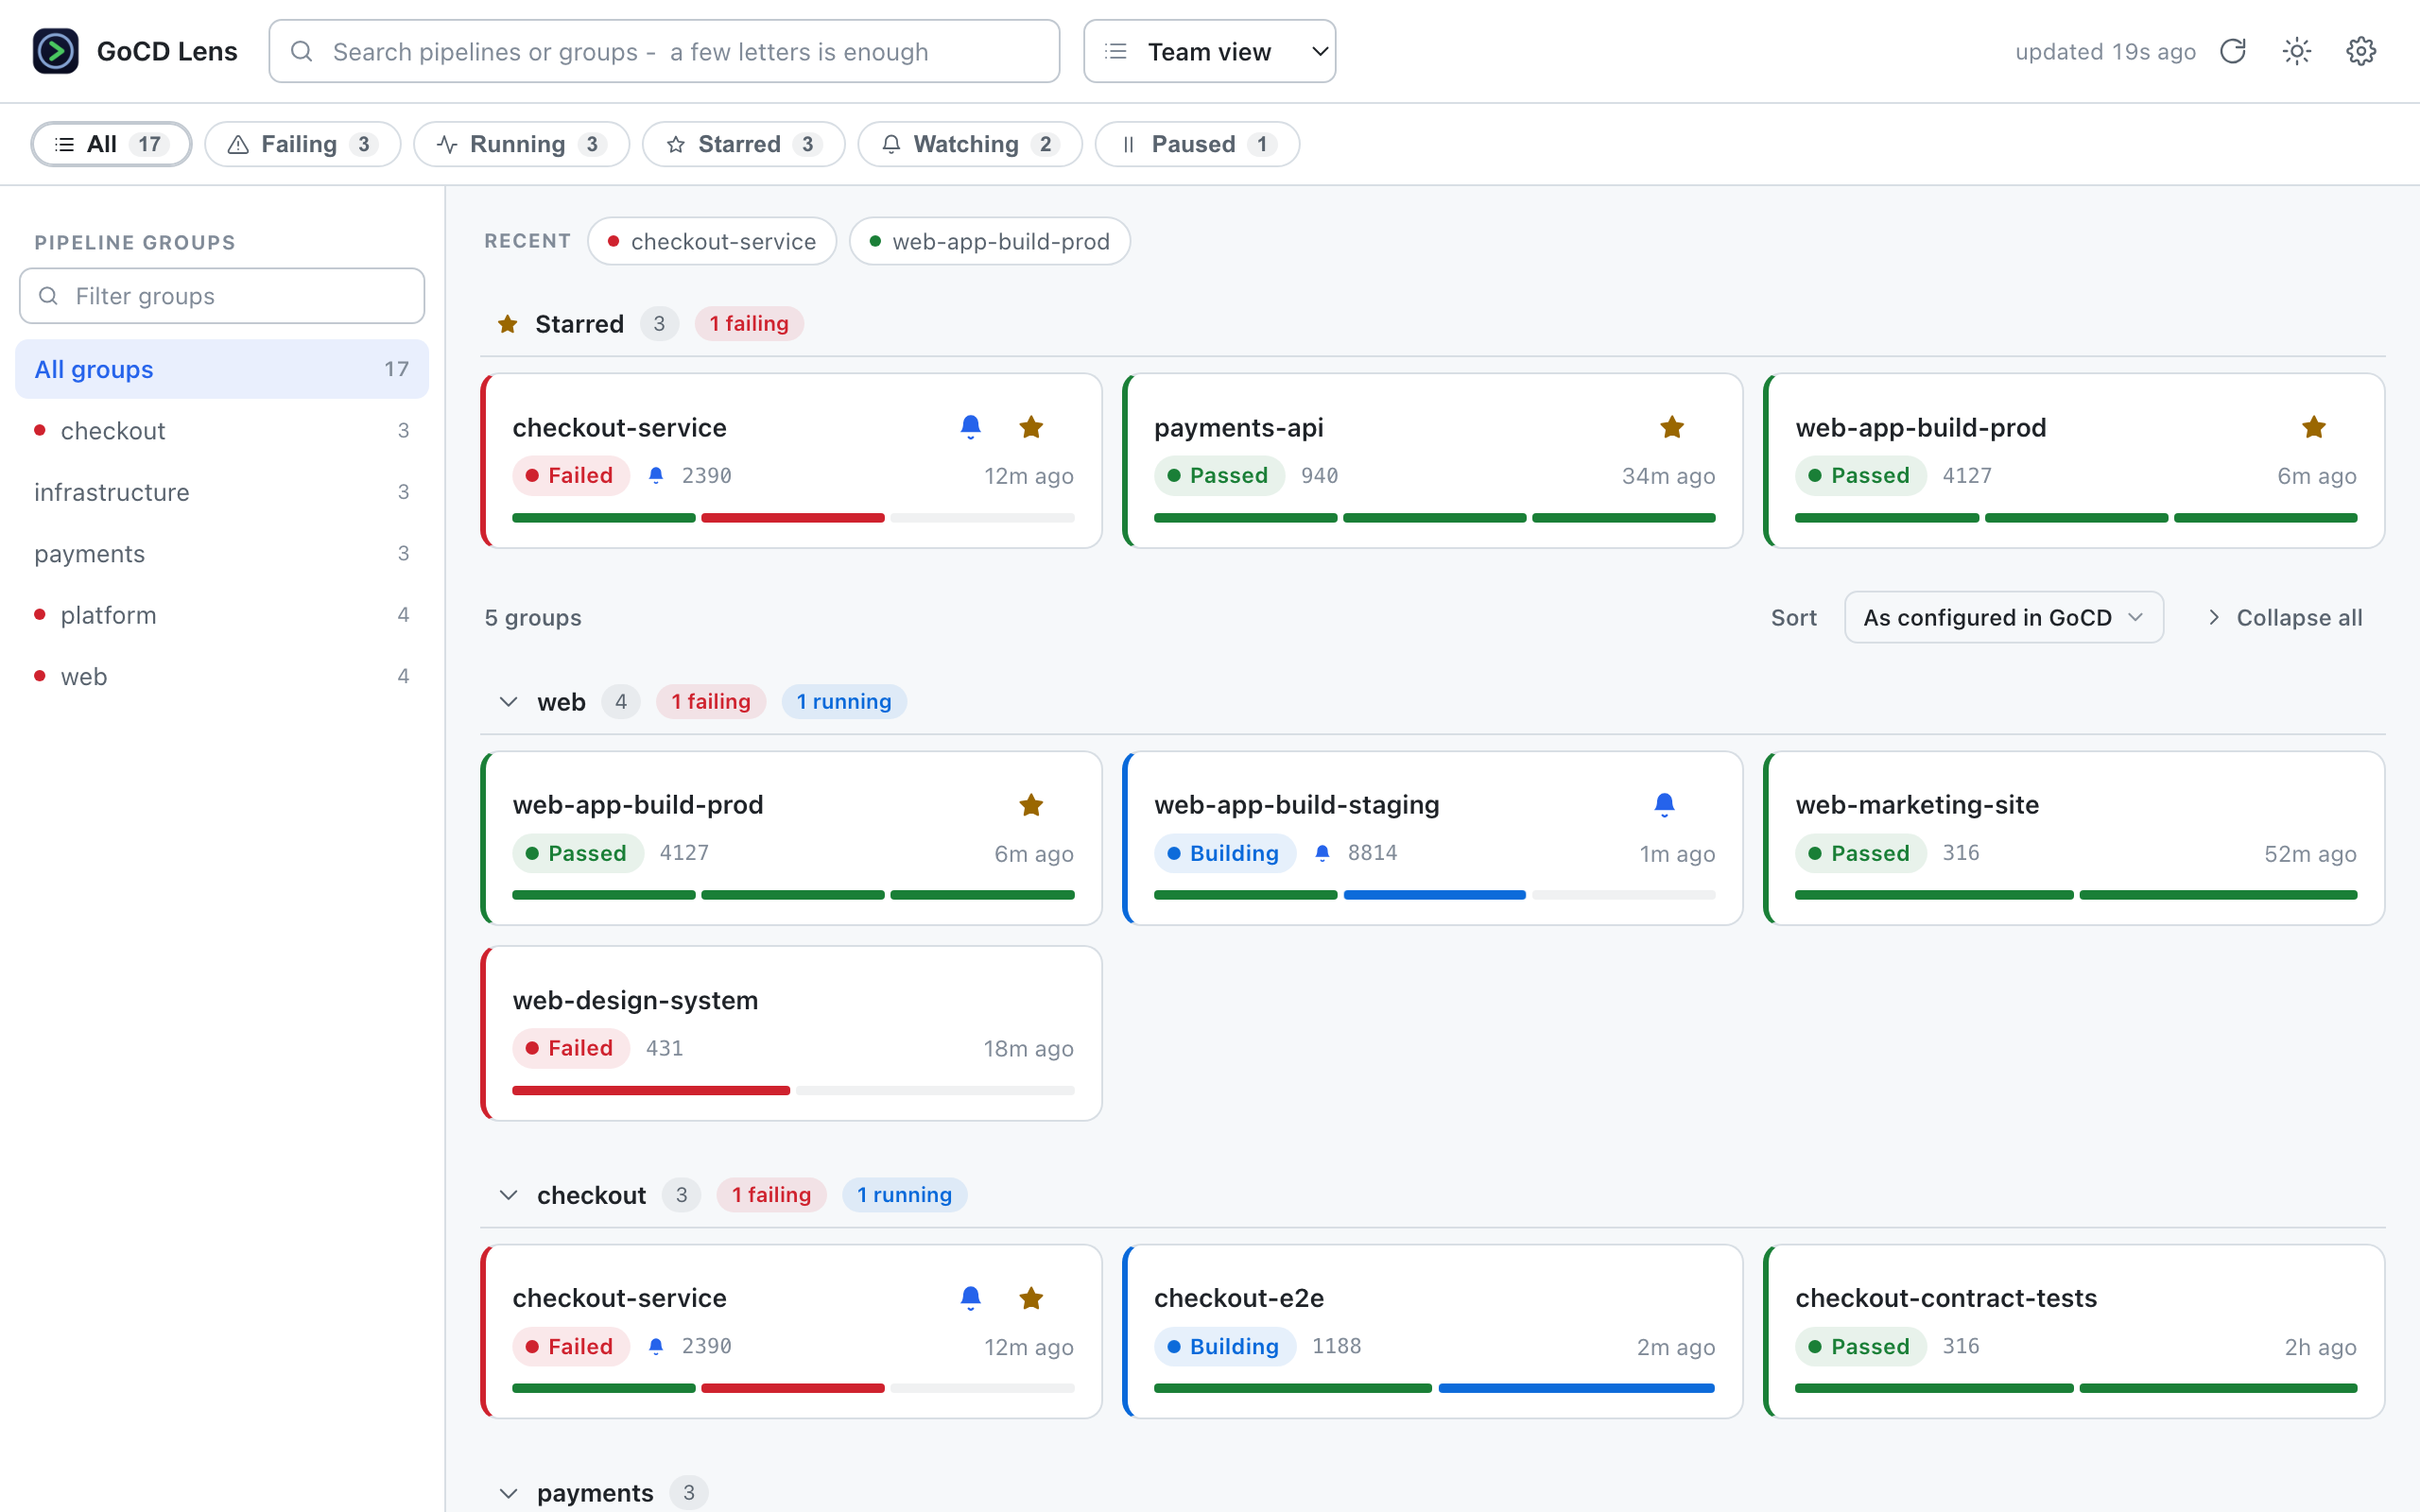
Nothing here costs a request per pipeline, and no screen tries to draw them all.
A single /api/dashboard call returns every group,
pipeline, pause state and latest run. There is no per-pipeline
polling anywhere in the extension.
Every card carries a segment per stage in pipeline order, so a red third segment tells you it got through build and test and died in deploy — before you click anything.
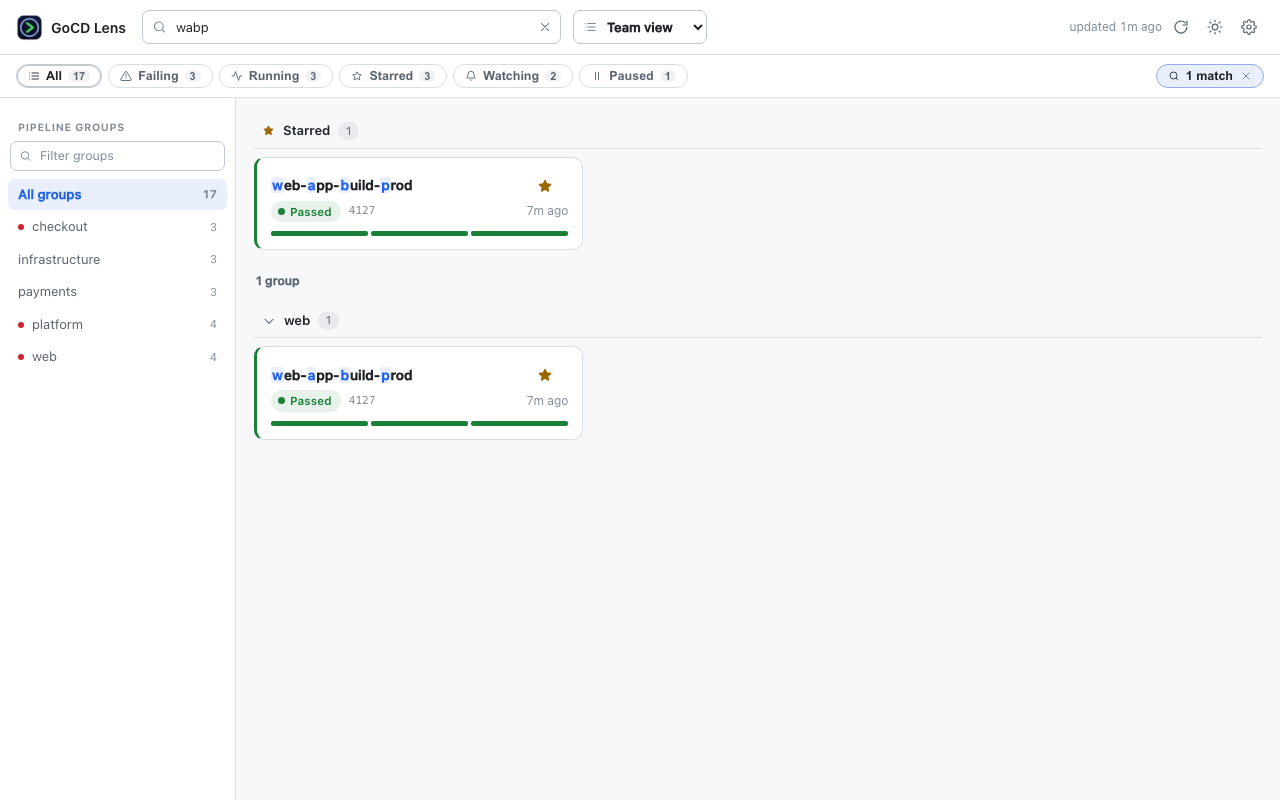
Type wabp and get web-app-build-prod,
with the matched letters picked out. Scrolling an alphabetical
list is not a search.
A star pins a pipeline to the top of every list. A bell interrupts you when it starts and when it finishes. Wanting something in reach and wanting to be interrupted by it are different wishes.
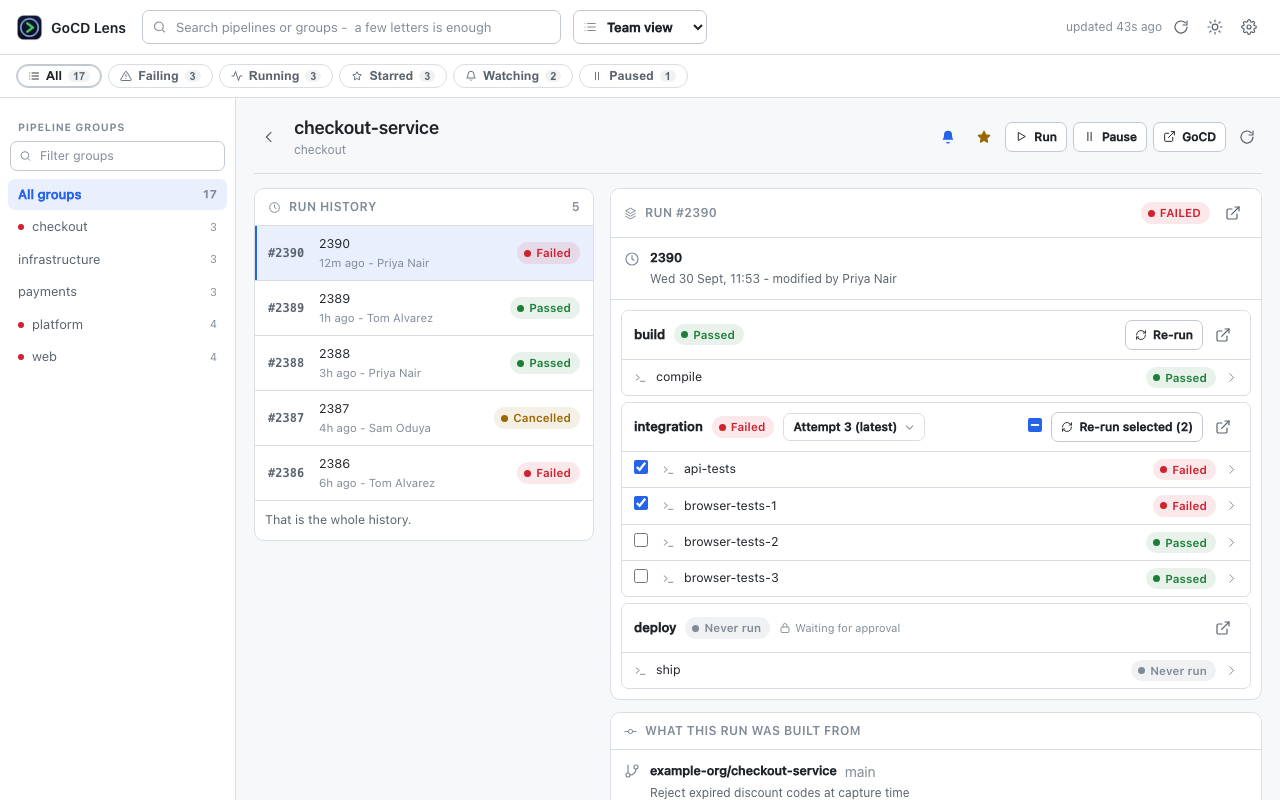
A stage of a dozen parallel end-to-end jobs is normal. Each job carries a checkbox with the failed ones already ticked, so retrying one takes a click — instead of burning twelve agents to find out.
The last payload is cached to disk. Drop the VPN and the dashboard still shows yesterday's failure, with a banner saying so and when it was from.
Run history that pages as you scroll, the selected run's stages and jobs, manual approval gates marked as gates rather than as failures — and underneath, what the run was actually built from: repo, branch, commit, author, message, one click to the diff.
Chained pipelines show the upstream run that triggered them, one click away.
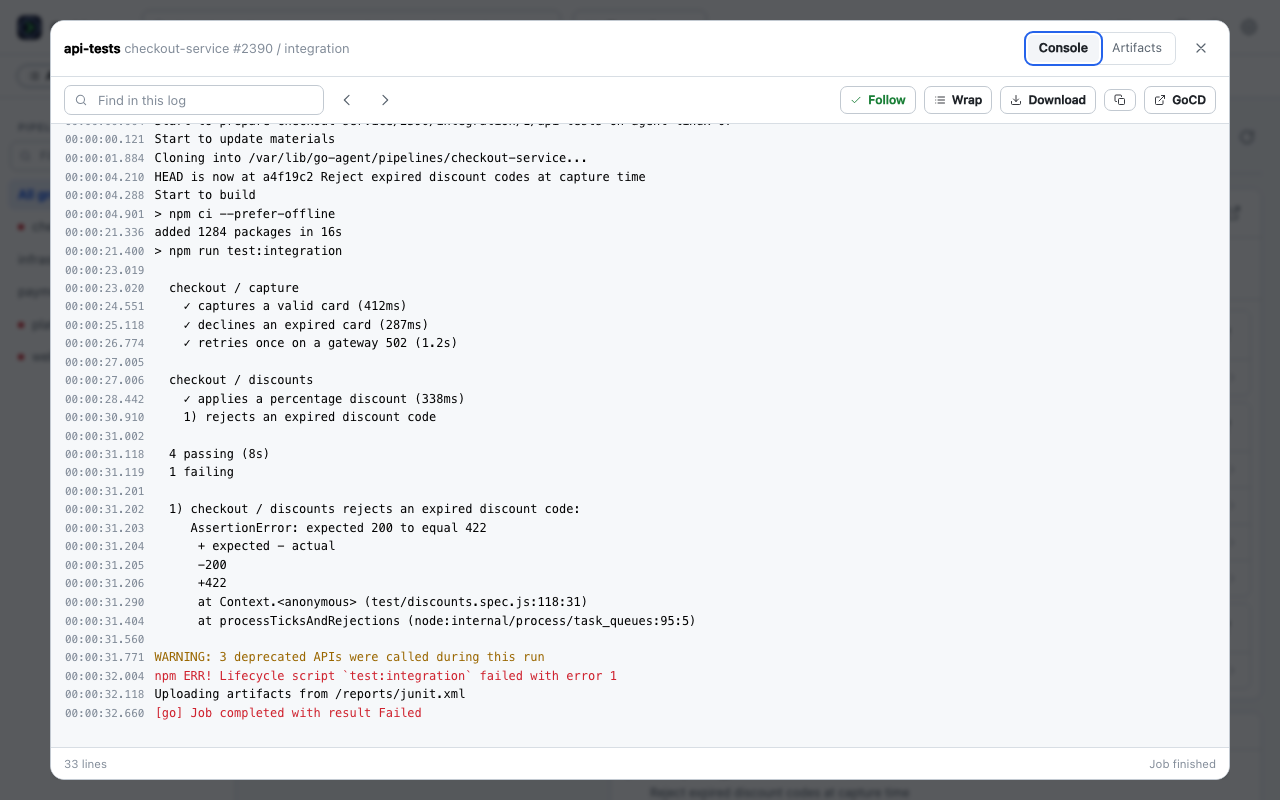
Live while the job runs, fetching only the lines added since the last poll. Severity colouring, search with next and previous, wrapping, download the whole thing, and the artifact tree behind the second tab.
Build logs are the least trustworthy data in the product, so nothing in this extension ever assigns markup — every line reaches the screen as a text node.
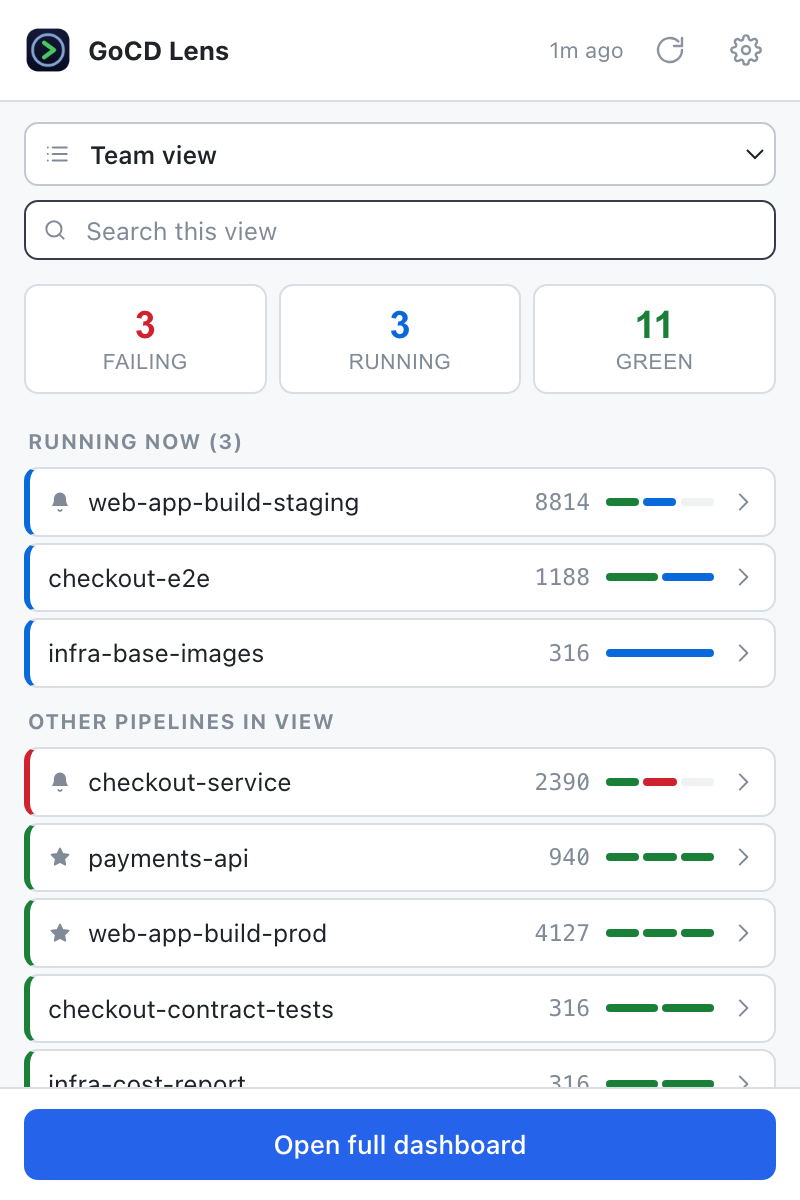
The badge counts what is running, because that is
the thing that changes. With nothing running it turns red and
counts failures. An amber ! means it is showing
cached data because GoCD is unreachable.
The popup gives you the same view picker, what is running now, then everything else — sixteen rows at a time.
Worth being explicit about, because a dashboard everyone leaves open can quietly become a load problem.
A view narrows the payload at the server, which on a large instance is the difference between megabytes and kilobytes per poll. Several tabs and the popup share one cache, so three open tabs make one request, not three. Unattended background checking ships off: traffic with nobody watching deserves an explicit yes.
The extension can reach exactly one host: the one you named. These are not slogans — a test enforces each of them against the actual files.
chrome.storage.local.
chrome.storage.sync — which uploads to Google and
copies to every machine on your account — is never used anywhere.
host_permissions is an empty list. Access to one origin
is granted at the moment you press Connect.
tabs,
cookies, webRequest,
history or scripting permission either.
Three ways to sign in, starting with the session your browser already has — which stores nothing at all. Read the full privacy policy.
One click from the Chrome Web Store. Needs Chrome 116 or later, and works the same in Microsoft Edge and Brave, which install Chrome Web Store extensions directly.
On first run the setup page opens. Enter the GoCD address you normally
use — usually ending in /go — and press Connect. Setup
verifies the credential against your server before saving it,
so a typo or a blocked session surfaces there and then rather than as
a mysteriously empty dashboard later.
It is a separate dashboard built for big instances. One
/api/dashboard call loads every group, pipeline and
latest run; each card carries a per-stage strip, so you see which
stage broke without opening anything; four letters find a pipeline;
and starring, watching, re-running selected jobs in a stage and
tailing a console log all happen on the screen you are already on.
It reads GoCD's public REST API, so the data is the same data your
server already has.
Only if you pick token or password sign-in, and then only in
chrome.storage.local on your own machine. The default
mode rides the GoCD session your browser already has and stores
nothing at all. The settings page can learn the last four characters
of what is stored — enough to tell two tokens apart — and nothing
more.
One request per poll, not one per pipeline. Unchanged data costs an empty 304, a hidden tab does not poll at all, several tabs share one cache, and watching a pipeline adds no requests at all. For comparison: GoCD's own dashboard polls with two requests per cycle; this makes one.
Yes. Requests are made from your machine over the same network stack as the GoCD tab beside it, and Chrome uses your OS trust store, so an internal certificate authority just works. If the VPN drops, requests fail in seconds rather than hanging and the dashboard keeps showing the last data it loaded. The one setup that can bite is an SSO or auth proxy that answers API requests with an HTML login page — switch to a personal access token, which carries its own credential and does not depend on cookies.
Yes. It is a Manifest V3 extension needing Chrome 116 or later, and both install Chrome Web Store extensions directly. Text in the extension says "browser", not "Chrome", for that reason.
No. There are no content scripts at all, and no tabs,
cookies, webRequest,
history or scripting permission. It ships
unable to reach any site until you name your server.
No. It is an independent, MIT-licensed tool built on GoCD's public REST API, not affiliated with or endorsed by the GoCD project or ThoughtWorks. It is a browser version of lazygocd, a terminal UI for the same problem, and follows its endpoint choices.
Yes — MIT licensed, and the whole thing is on
GitHub. There
is no build step and no dependency to audit: the files in
src/ are the files that run, so what you read is what
is installed. Issues and pull requests are welcome —
CONTRIBUTING.md
covers how to raise either.
Neither. No backend, no account, no third party, no sign-up. It runs entirely in your browser, and the only host it contacts is your GoCD server.